
Visualizing a Shelving Configuration Without Requiring CAD
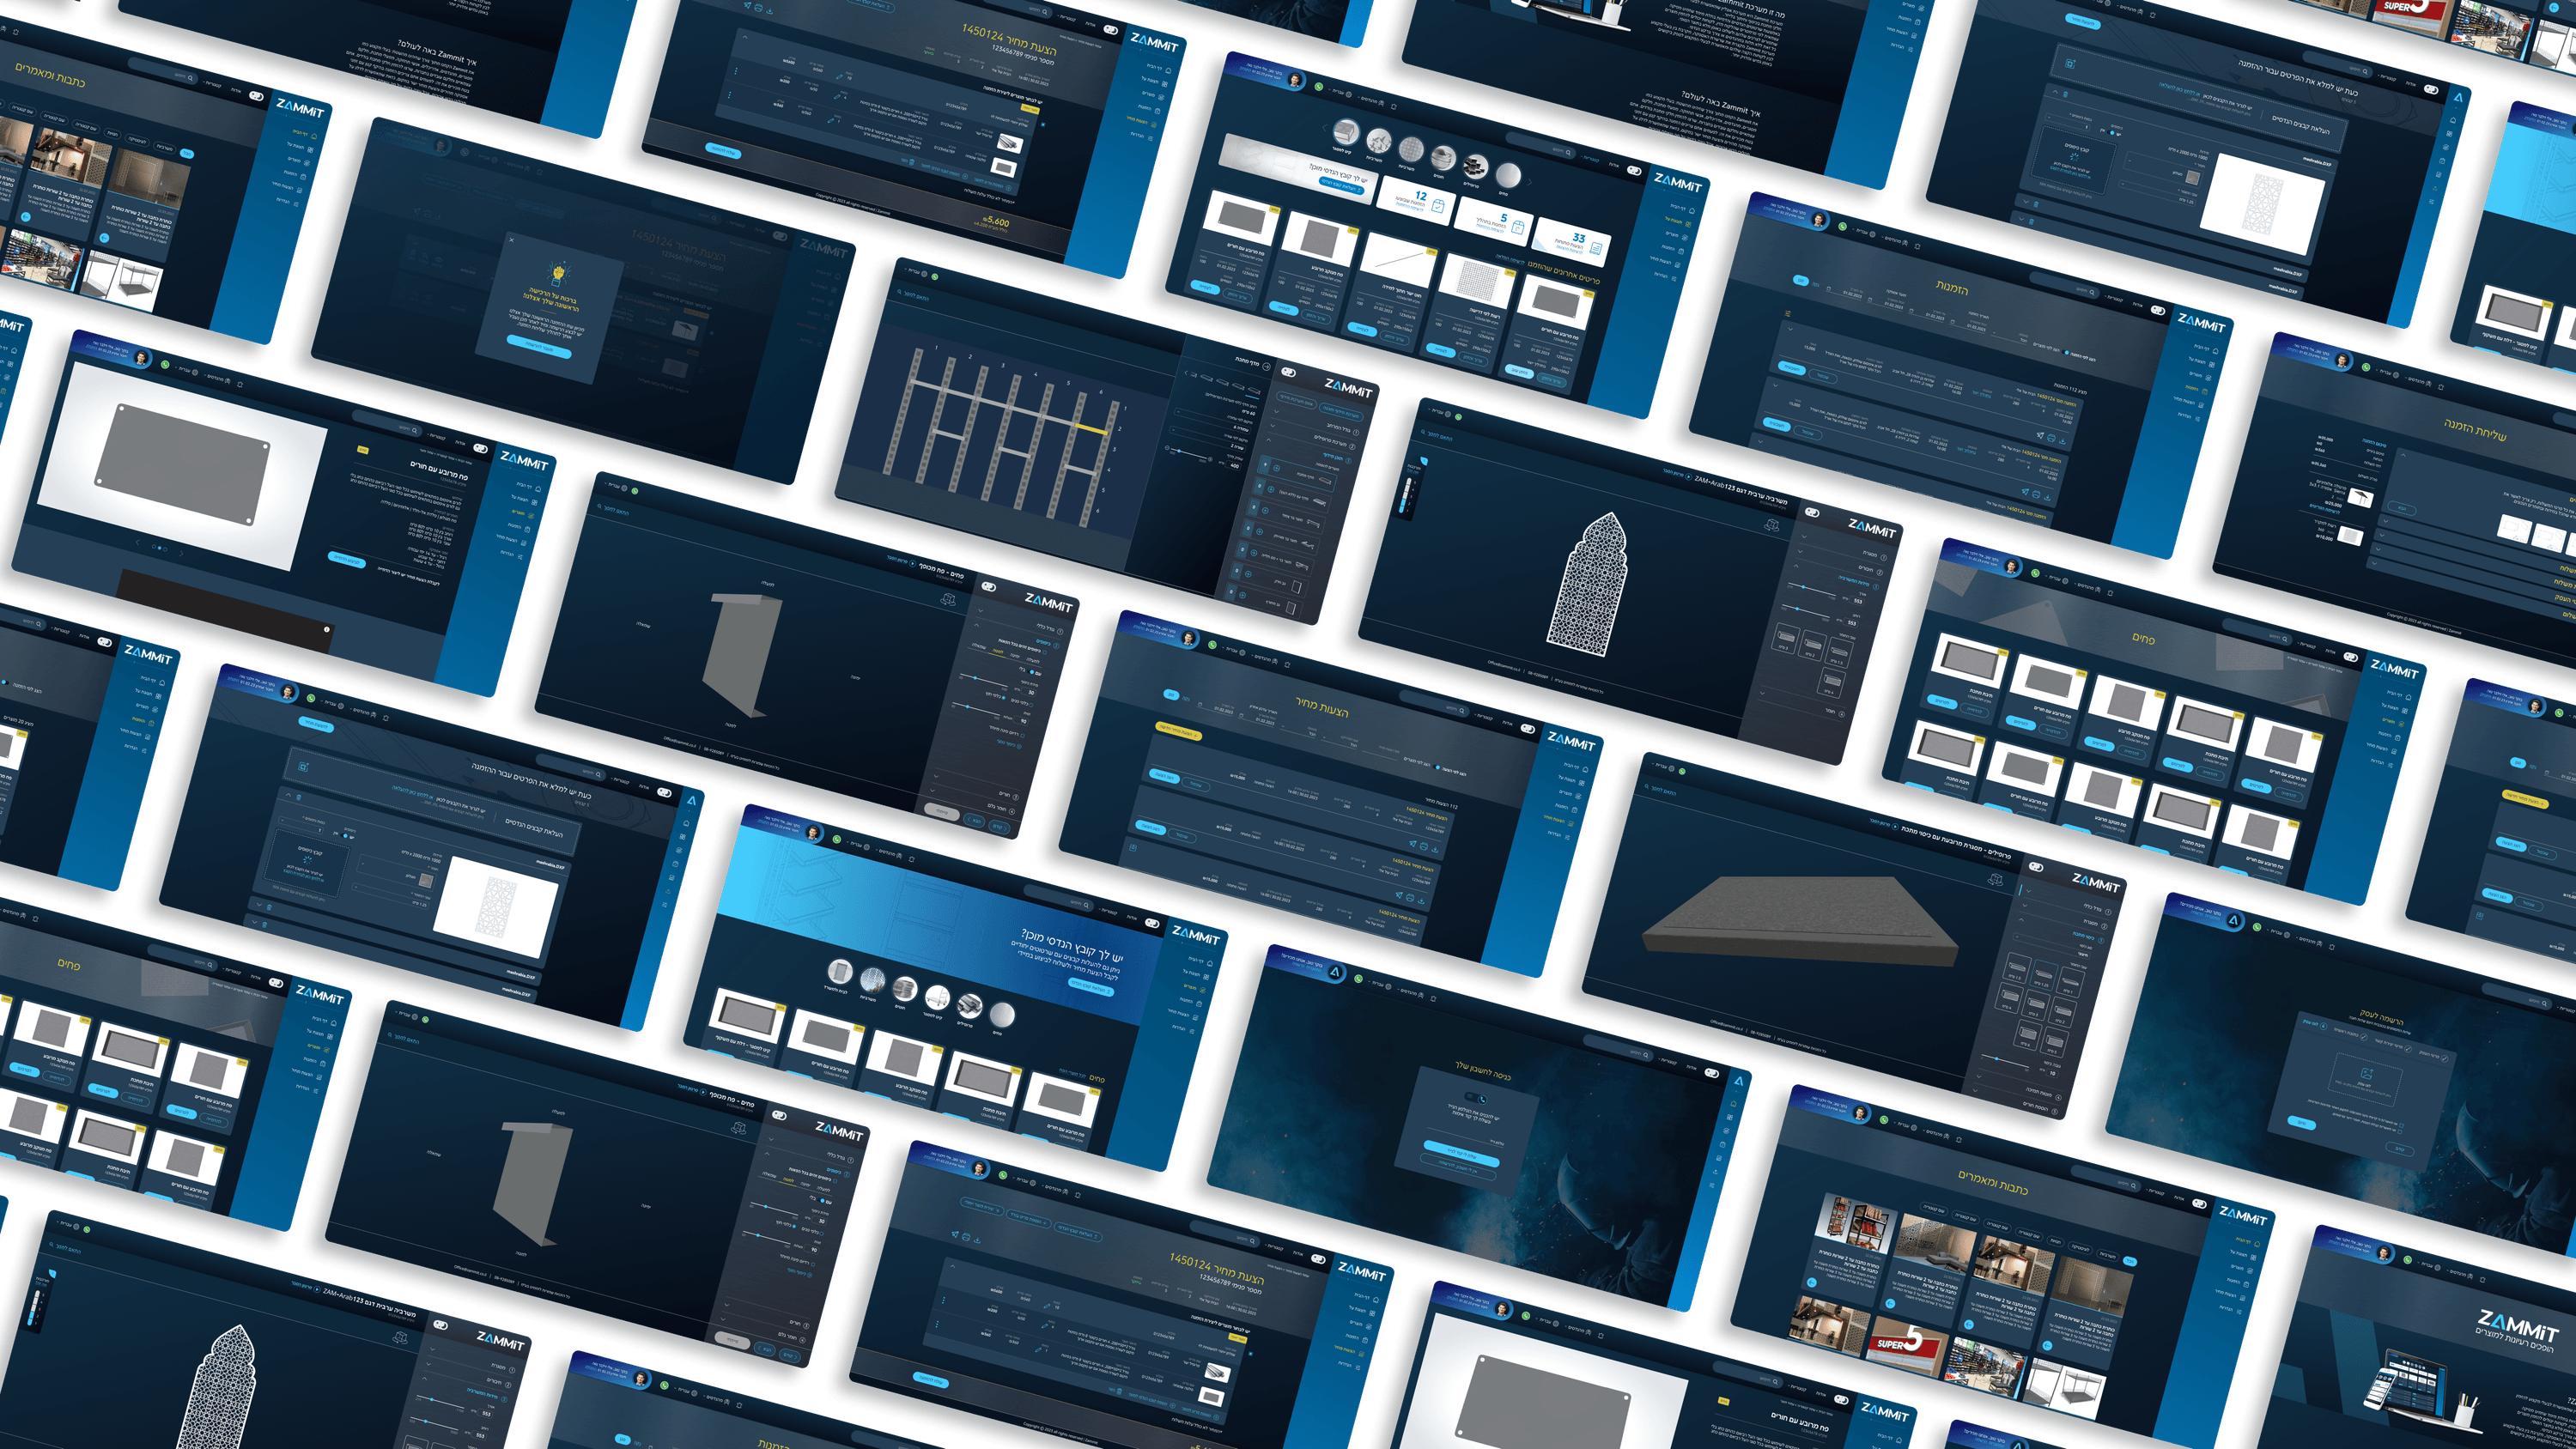
The flagship surface at Zammit was the Retail Shelving Planning System — a spatial configurator where users set overall dimensions, shelf count, edge profiles, per-shelf depth, and placement. The hard part, from an R&D standpoint, is that this is genuinely spatial data, and the user base explicitly does not have CAD knowledge. So the visualization had to represent a real, manufacturable object faithfully enough to be trusted, while abstracting away everything that makes CAD intimidating. I designed the visual representation to update in step with the configuration, so a change to per-shelf depth or shelf count read immediately as a change in the thing being built — not as numbers in a table. That tight coupling between input and visual is the engineering interesting bit: the picture is bound to the same constrained model the DriveWorks engine enforces, so what the user sees can't drift from what the factory can actually fabricate. For your team, the lesson is that data visualization in a configurator isn't a chart layer bolted on top — it's a faithful, real-time projection of the constrained product model. Get that binding right and the visualization becomes the user's confidence that their custom order is correct before they commit.
Related articles

About
Making complicated into easy for users.
Senior product designer with a decade of work across complex systems - financial risk platforms, legal operations, healthcare apps, manufacturing tooling and insurance portals. The common thread is depth: products where the data is rich, the users are expert, and the interface has to disappear into the work.