
Visualizing a Community, Not a Dashboard
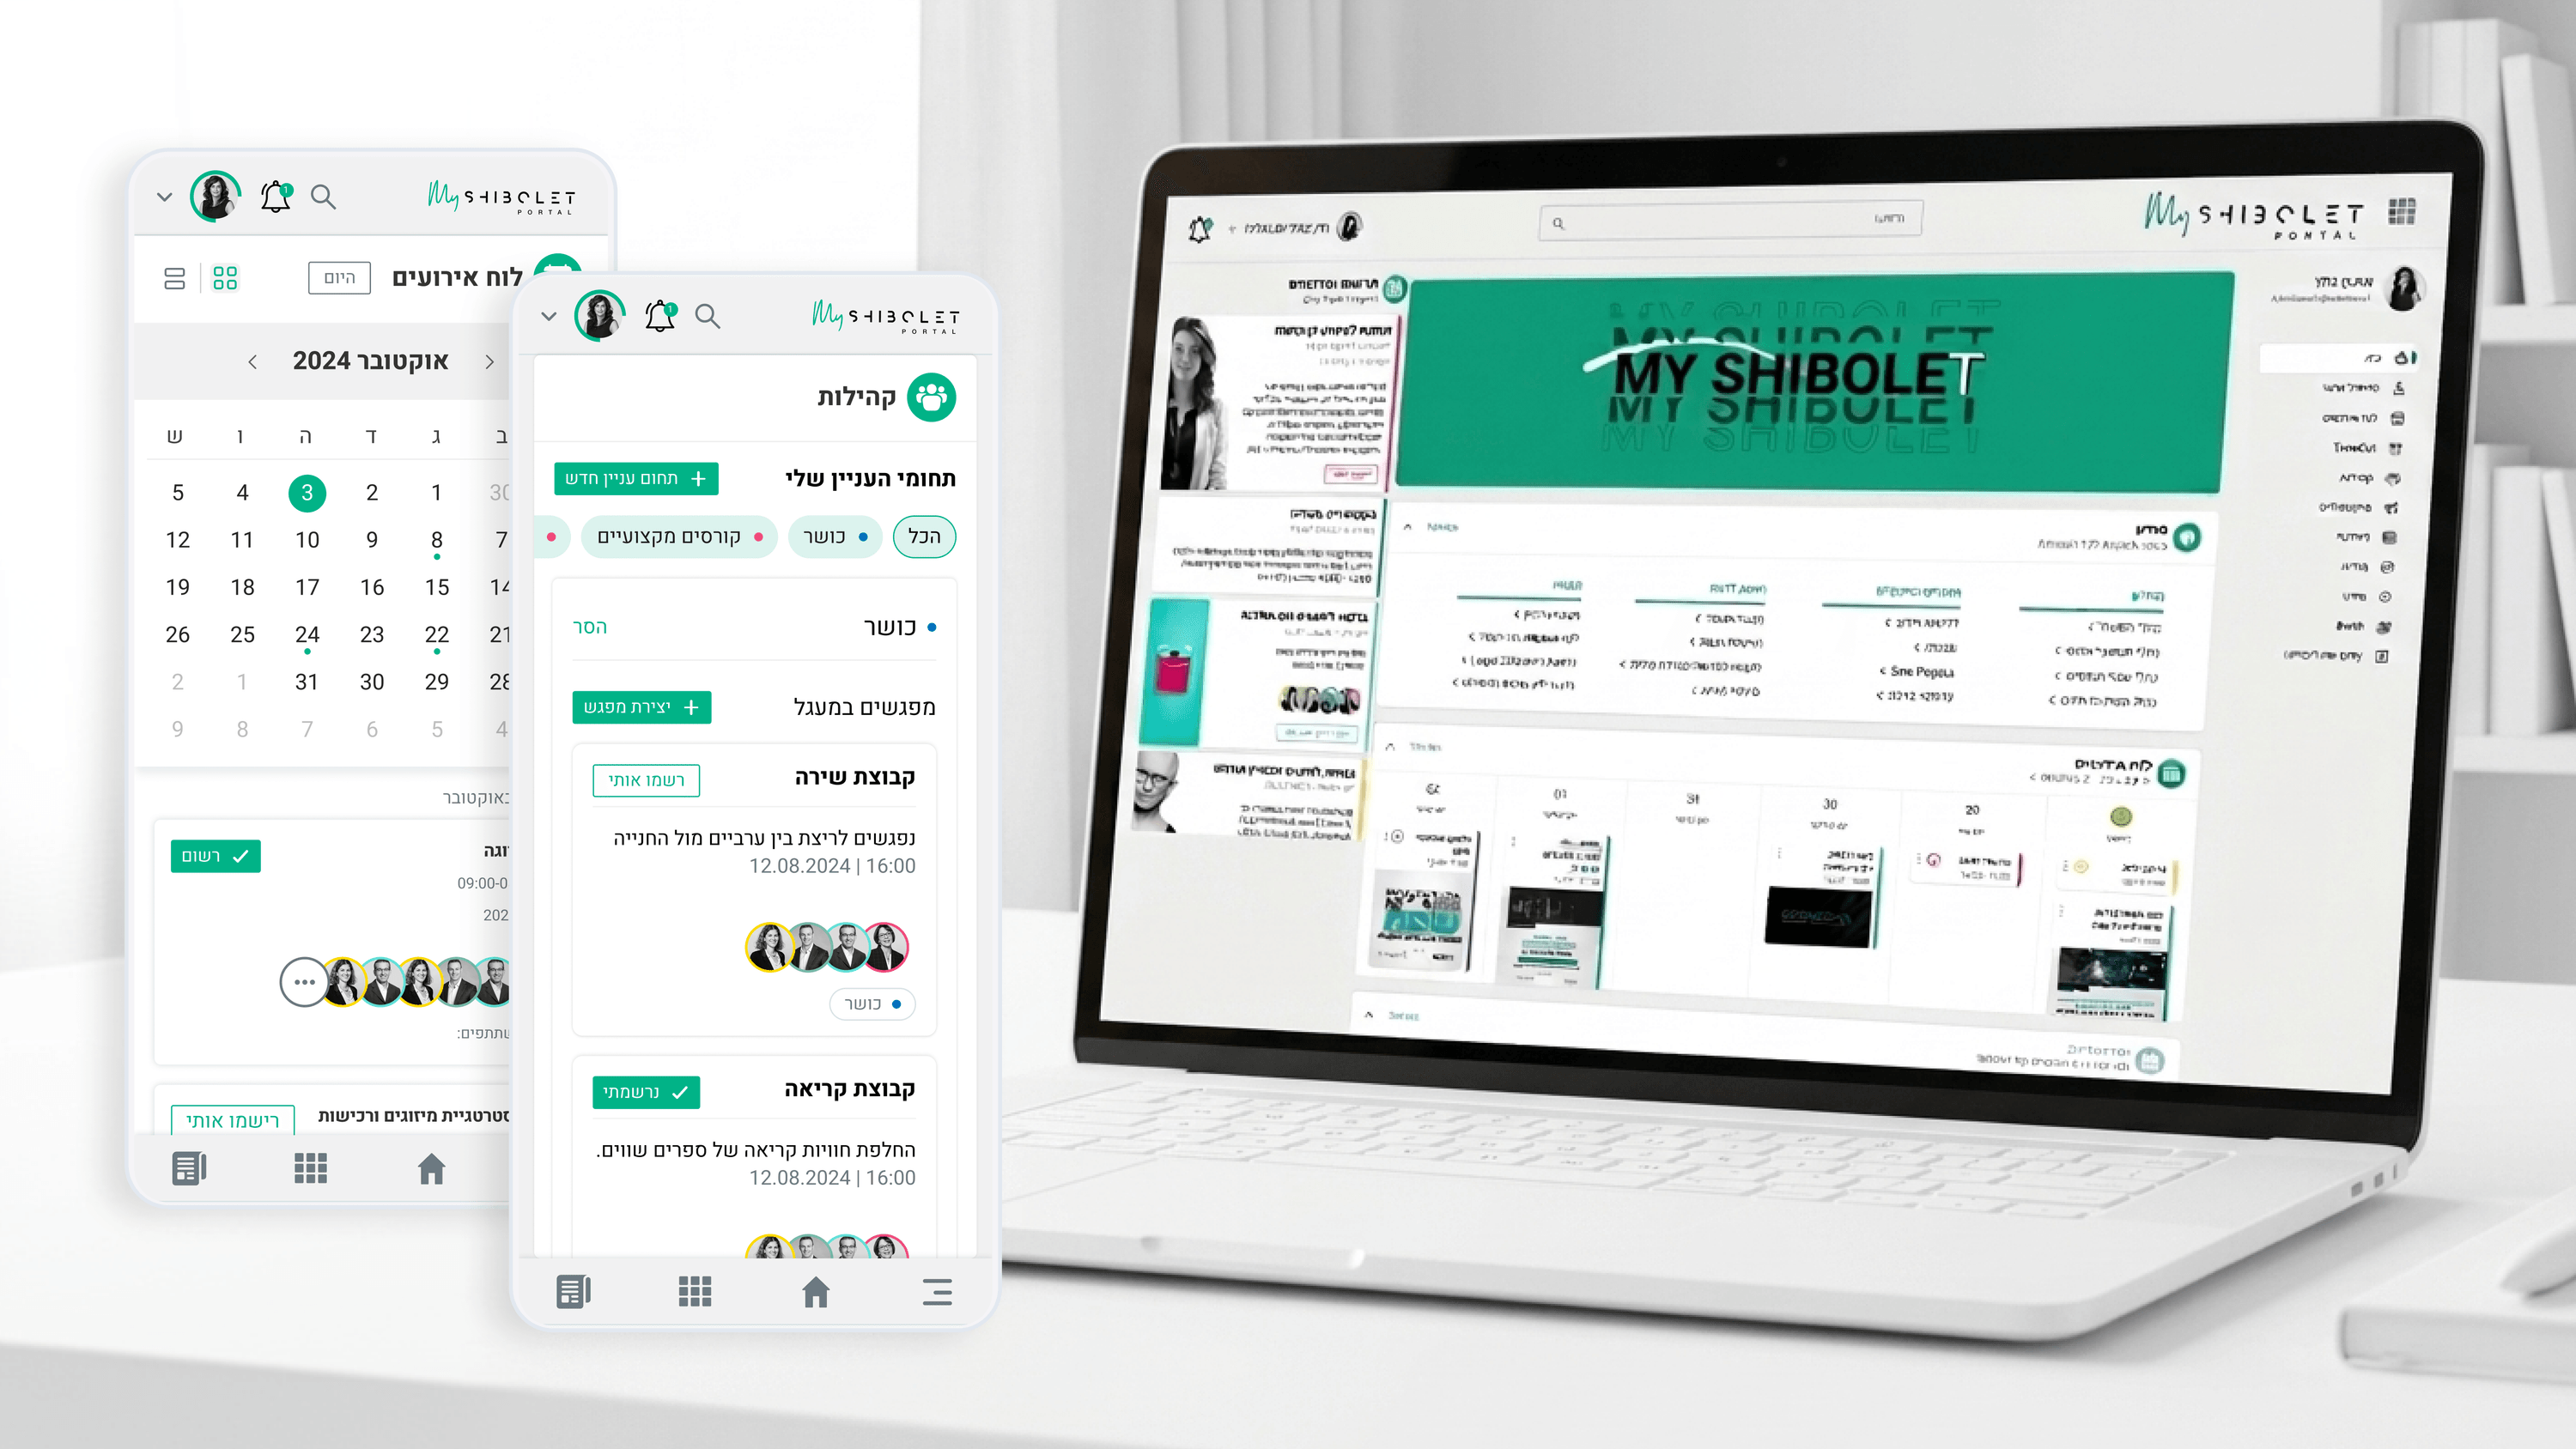
When R&D hears data visualization, the mind jumps to dense analytics dashboards. Shibolet's internal community hub needed the opposite, and that distinction shaped what we built. This was a community hub for a law firm's employees, not an admin reporting tool, so the visual data work was about making community information scannable and inviting rather than charting KPIs. The real challenge was representing things like upcoming events, available courses, benefits, and interest-based groups so an employee could grasp at a glance what was relevant to them. I leaned on structured, lightweight visual patterns: clear groupings, status cues, and simple signals of activity, like indicating who else was attending an event or active in a group, so the hub felt alive without turning into a spreadsheet. For your engineers, the constraint worth naming is fitness for purpose. We weren't building a charting library or a metrics engine. We were rendering community state in a form that matched the firm's gravitas while staying warm and readable. Project-specific data visualization means the representation serves this domain's question, which here was always what is happening in my community and what is for me, never abstract reporting for its own sake.
Related articles

About
Making complicated into easy for users.
Senior product designer with a decade of work across complex systems - financial risk platforms, legal operations, healthcare apps, manufacturing tooling and insurance portals. The common thread is depth: products where the data is rich, the users are expert, and the interface has to disappear into the work.